Blog/Heatmap Without Tracking Code
How-to

How to Get a Heatmap Without Installing Any Tracking Code

Heatpoints Lab·7 min read

Every heatmap tutorial starts the same way: "paste this snippet into your site's <head>." Which is great — until you can't. The page isn't live yet, the site isn't yours, or legal just vetoed another third-party script. Here's how to get attention data anyway, and an honest look at what each workaround can and cannot tell you.

Four situations where a tracking script is off the table

Traditional heatmap tools — Hotjar, Clarity, Crazy Egg — work by recording real visitors. That requires two things: a JavaScript snippet in production, and enough traffic to aggregate. In practice, four situations break at least one of those requirements:

  • The page isn't live yet: Staging environments, pre-launch landing pages, password-protected stores, Figma mockups. Even if you could install a script, there are zero visitors to record. Tracking-based heatmaps are structurally blind before launch — exactly when design decisions are cheapest to change.

  • You don't control the site: Agencies auditing a prospect's page, freelancers pitching a redesign, marketers whose snippet request sits in the dev backlog for three sprints. If you can't touch the <head>, you can't track.

  • GDPR and consent: Behavioral tracking is personal data processing. That means consent banners, DPO reviews, and a dataset that only includes the visitors who clicked "accept" — a self-selected sample. For some teams the compliance overhead alone kills the project.

  • The client says no: Security review, performance budget, or plain policy: many companies refuse third-party scripts on production, full stop. You can't argue a snippet past a hard no.

To be clear: when none of these apply — the page is live, you own it, and consent is handled — script-based tools are genuinely hard to beat. They record what real users actually did: clicks, rage clicks, scroll depth, full sessions. If that's your situation, use them. This article is for everyone else — and we keep an honest breakdown of that trade-off on our Heatpoints vs Hotjar page.

The classic workarounds — and where they break

Teams blocked from installing a script usually reach for one of three substitutes. Each has a real use, and each has a failure mode worth knowing before you rely on it.

01

Screenshot + team opinions

Drop the design in Slack, ask "where does your eye go?" Free and instant — but everyone on your team is an expert viewer who already knows where the CTA is. Fresh-eyes attention can't be simulated by people who built the page, and the loudest opinion in the thread usually wins.

02

User panels and five-second tests

Real humans, real reactions — this is the strongest substitute, and for questions about comprehension ("what does this company do?") it beats any algorithm. The costs: days of turnaround per iteration, a per-test price, small samples, and panelists who know they're being tested and look harder than a real visitor ever would.

03

Testing on yourself with browser tools

Extensions and local session recorders only measure one person: you. And you are the single least representative visitor your page will ever have — you know the layout, the copy, and where everything is supposed to be.

The common gap: none of these give you a repeatable, unbiased read on where first-time attention lands — the thing a heatmap is for.

The predictive method: a heatmap from pixels, not visitors

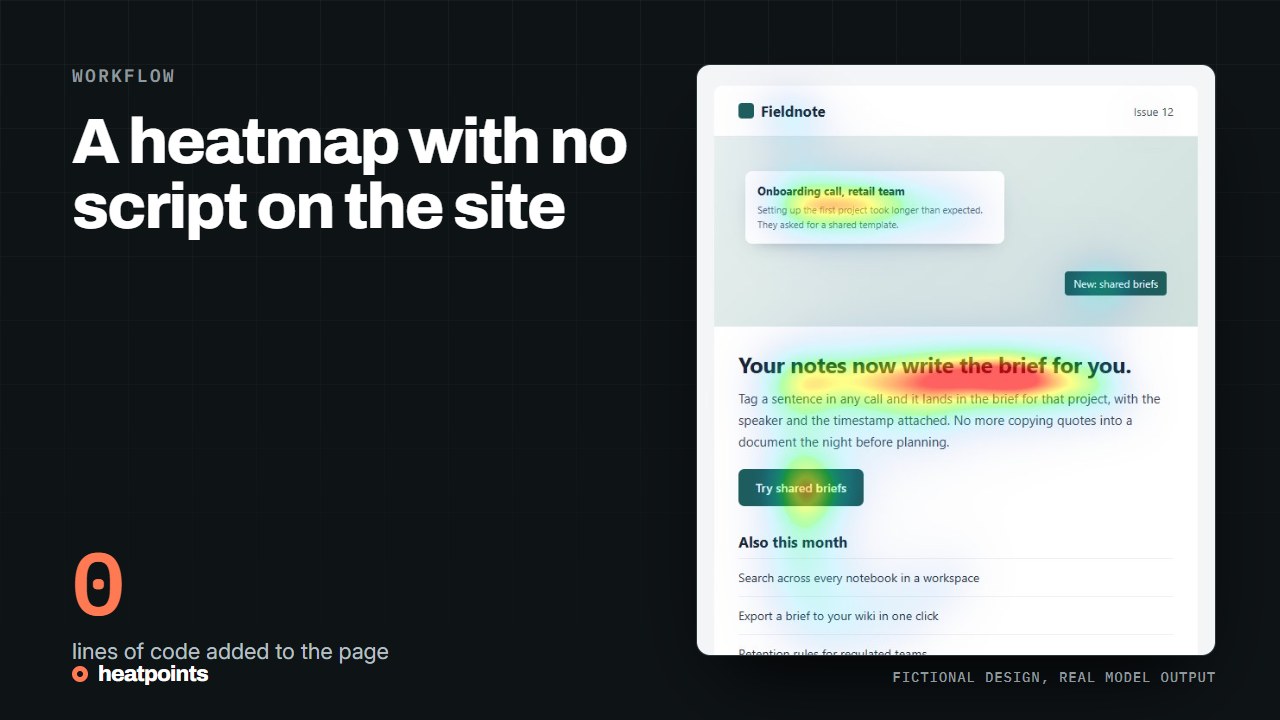
There's a fourth option that skips the script entirely. Saliency models are neural networks trained on large eye-tracking datasets — hundreds of thousands of recorded human gaze samples. Given any image, they predict where eyes are most likely to land in the first moments of viewing. No snippet, no traffic, no waiting: the input is a screenshot or a URL, and the output is a probability map of attention, in seconds.

Because the model analyzes pixels rather than people, there is nothing to consent to — no visitor data is collected, so the GDPR question simply doesn't arise. And because it doesn't need traffic, it works on a staging URL, a competitor's page, or a mockup that hasn't shipped.

Now the honest part, because it matters: a predictive heatmap models the first seconds of attention, not the full visit. It tells you whether your headline out-competes your hero image, whether the CTA is visually findable, whether a decorative element is stealing focus. It does not tell you what users clicked, how far they scrolled over a five-minute session, or whether they converted. First-glance hierarchy is its whole job — our eye tracking vs AI heatmaps guide covers where each method wins in depth.

Accuracy isn't a marketing adjective here; it's a published benchmark. Heatpoints runs on UNISAL, a saliency model scoring an AUC-Judd of 0.872 and an NSS of 2.322 on the MIT300 benchmark — numbers you can verify, and that we document on our evaluation page. Other predictive tools exist too — Attention Insight (€29/mo for 40 watermarked analyses) and EyeQuant (quote-based, around $499/mo); Heatpoints Pro is €29/mo for 100. The full grid lives on our comparison page.

What does this look like at scale? We ran the model over 93 real SaaS landing pages for our attention study — no tracking code on any of them, obviously, since none of those sites are ours. The results were uncomfortable: on 81% of pages, the attention peak sat outside the hero section the team designed to carry it. Even Airtable's landing page scored 23/100.

81%

OF PAGES PEAK OUTSIDE THE HERO

44.1

AVERAGE ATTENTION SCORE / 100

0

PAGES SCORING 80 OR ABOVE

93 REAL SAAS LANDING PAGES, SCANNED WITHOUT A SINGLE TRACKING SNIPPET. UNISAL OUTPUT — FULL METHODOLOGY AND DATA AT /STUDY.

Tracking-based heatmaps

SCRIPT
  • JS snippet in production required
  • Needs weeks of real traffic to aggregate
  • Consent banners and GDPR review
  • Measures real clicks, scrolls, sessions — unbeatable post-launch

Predictive heatmaps

MODEL
  • Works from a URL or screenshot
  • Results in seconds, zero visitors needed
  • No user data collected — nothing to consent to
  • Predicts first-seconds attention only — not full journeys
TWO DIFFERENT INSTRUMENTS: ONE MEASURES WHAT VISITORS DID, THE OTHER PREDICTS WHERE EYES LAND FIRST.

The "behind login" case: screenshot in, heatmap out

Some pages can't even be reached by URL: app dashboards, onboarding flows, checkout steps, admin panels, email templates in a preview pane. No crawler gets there, and installing tracking inside a product is an even harder sell than on a marketing site.

This is what upload mode is for. The workflow is deliberately boring:

  • Capture a screenshot — a full-page capture from your browser's dev tools, a plain screengrab, or a Figma frame export
  • Upload the image — no URL, no access, no script anywhere
  • Get the heatmap and attention score for that exact screen, in seconds
  • Iterate: change the design, re-upload, compare scores before anything ships

Because the input is just an image, it works on things that don't exist yet — a mockup, a wireframe, a rebrand candidate. And if the question is about your copy rather than your layout, the same no-script logic powers our words map, which predicts attention at the word level.

The honest workflow

No tracking code doesn't mean no data. It means a different kind of data: predicted first-glance attention instead of recorded behavior. Use the predictive method when a script is impossible — pre-launch, no access, consent constraints, client refusal — and when you want to iterate on designs in minutes instead of weeks. Then, once the page is live and instrumented, let behavioral tools confirm what people actually do.

The two aren't rivals. One predicts the first impression; the other measures everything after it. The mistake is having neither.

Try it now

Get your page's attention score — from a URL or a screenshot. No tracking code, no signup.

Get my free score