Blog/Eye Tracking vs AI Heatmaps
Research Methods

Eye Tracking vs AI Heatmaps: Which Should You Use?

Heatpoints Lab·8 min read

Eye tracking has been the gold standard for understanding visual attention since the 1990s. But lab-grade hardware costs $15K+ per study. AI models trained on that same eye-tracking data can now predict attention in milliseconds, for free. So which should you use?

The answer isn't one or the other. It depends on what you're trying to learn, how fast you need it, and how much uncertainty you can tolerate. This guide breaks down both methods so you can choose with confidence — or combine them strategically.

What eye tracking actually measures

Eye trackers use infrared light and high-speed cameras to record where a person's gaze lands on a screen, typically at 60-1200 Hz. The raw data is a stream of coordinates that researchers decode into meaningful events:

  • Fixations: Points where the eye pauses for 100-600ms — this is where visual processing happens. More fixations on an element means it's drawing attention.

  • Saccades: Rapid eye movements between fixations. They reveal the order in which a person scans the page — the scan path — and which elements are connected in the viewer's mental model.

  • Gaze duration: Total time spent looking at a region. Long dwell times can mean high interest or high confusion — context determines which.

  • Scan paths: The full sequence of fixations mapped over time. They show whether users follow the intended visual hierarchy or wander aimlessly looking for the next step.

The hardware behind this — Tobii Pro Spectrum, SR Research EyeLink, Smart Eye Pro — ranges from $5,000 for a basic screen-based tracker to $50,000+ for head-mounted or high-frequency research systems. You also need a controlled lab environment: consistent lighting, calibrated monitors, and a quiet room free from distractions.

High-frequency research system50,000 $
Basic screen-based tracker5,000 $
AI heatmap scan0 $free
HARDWARE COST ALONE — BEFORE LAB TIME, PARTICIPANTS AND ANALYSIS. FIGURES FROM THIS ARTICLE. ILLUSTRATIVE.

Then there's the human cost. Recruiting 8-15 participants (the typical sample for a qualitative eye-tracking study), running sessions, cleaning data, and analyzing results takes 2-4 weeks from start to finish. It's rigorous. It's also slow and expensive enough that most teams only do it once — if ever.

What AI heatmaps predict

AI saliency models take a different approach entirely. Instead of measuring where one person looks, they predict where most people would look — based on patterns learned from massive eye-tracking datasets.

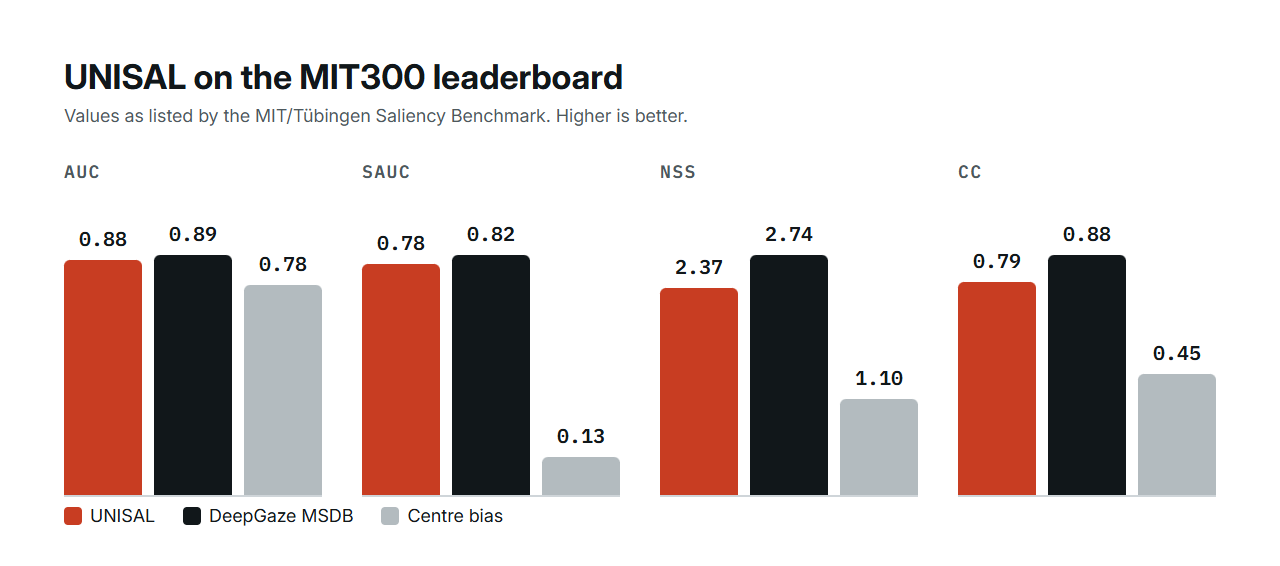
Modern architectures like UNISAL are trained on over 300,000 eye-tracking samples across multiple benchmark datasets (SALICON, MIT1003, DHF1K). The model learns the low-level visual features that reliably capture human gaze: high contrast edges, faces, text, color isolation, and spatial position. It then generates a probability map — a heatmap — showing where attention is most likely to concentrate in the first moments of viewing.

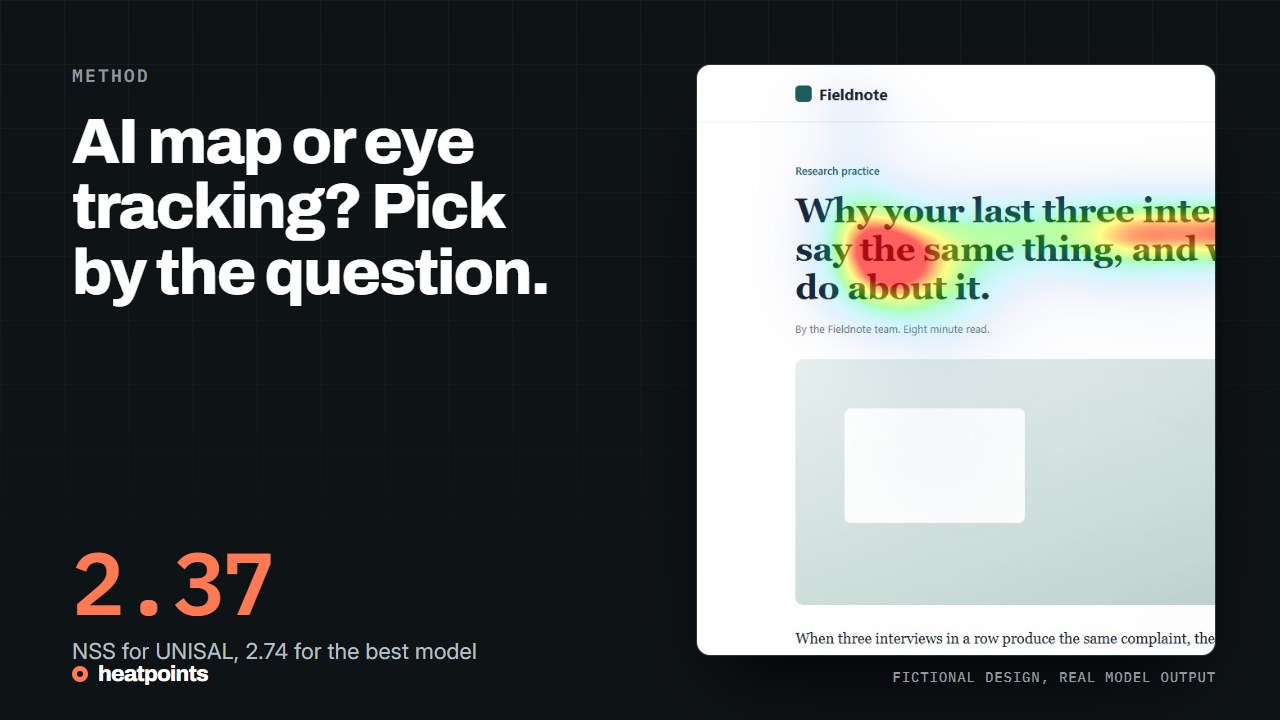
AI-predicted attention heatmap over a live landing page hero section
THE PROBABILITY MAP IN PRACTICE — PREDICTED FIRST-SECOND ATTENTION OVER A LIVE HERO SECTION. UNISAL OUTPUT, DROPNIR.COM, DESKTOP.

The key phrase is first-second saliency. AI heatmaps predict the involuntary, pre-conscious allocation of visual attention — where eyes land before the viewer has decided what to look at. This is the same signal that determines whether your headline gets read, your CTA gets noticed, or your hero image gets ignored.

What AI heatmaps don't capture is equally important. They can't model task-driven attention (a user searching for a specific button), individual differences (a designer sees a page differently than a first-time visitor), or reading behavior (how someone processes a paragraph of text). These are real limitations — and the reason eye tracking still has a role.

"Saliency models trained on eye-tracking data now match or exceed the inter-observer consistency of human participants on standard benchmarks. The bottleneck is no longer model accuracy — it's knowing which questions saliency can and cannot answer."

— Bylinskii et al., MIT/CSAIL, "What do different evaluation metrics tell us about saliency models?"

Head-to-head comparison

Here's how the two methods stack up across the dimensions that matter most for design and research teams:

Cost

Eye Tracking

$5,000 - $50,000 per study (hardware, lab, participants, analysis)

AI Heatmap

Free — or near-free at API scale

Time to results

Eye Tracking

2-4 weeks (recruitment, sessions, analysis)

AI Heatmap

Under 5 seconds per page

Sample basis

Eye Tracking

8-15 participants per study

AI Heatmap

Trained on 300,000+ eye-tracking samples

What it captures

Eye Tracking

Full gaze behavior: fixations, saccades, scan paths, dwell time

AI Heatmap

First-second visual saliency (pre-conscious attention)

Best for

Eye Tracking

Deep UX research, accessibility, regulatory contexts

AI Heatmap

Rapid design iteration, A/B test planning, quick audits

Ecological validity

Eye Tracking

Lab setting — controlled but artificial (lower)

AI Heatmap

Predicts natural viewing conditions (moderate)

0.87

AI vs human correlation on saliency benchmarks (CC score)

300K+

Eye-tracking samples used to train modern saliency models

<5s

Time to generate an AI attention heatmap

When to use each

The decision isn't binary. Each method excels in different contexts, and the smartest teams use both at different stages.

Eye tracking

LAB
  • $5,000 – $50,000 per study
  • 2–4 weeks from recruitment to results
  • 8–15 participants per study
  • Full gaze behavior: fixations, saccades, scan paths

AI heatmaps

MODEL
  • Free — or near-free at API scale
  • Under 5 seconds per page
  • Trained on 300,000+ eye-tracking samples
  • First-second saliency — no lab, no hardware
THE TRADE-OFF AT A GLANCE — DEPTH VS SPEED. FIGURES FROM THIS ARTICLE. ILLUSTRATIVE.

Choose eye tracking when you need:

  • Accessibility research — understanding how users with cognitive or visual impairments navigate interfaces
  • Medical device UIs or safety-critical systems where regulatory bodies require documented usability evidence
  • Reading comprehension studies — how users process body text, instructions, or legal copy
  • Longitudinal studies tracking how attention patterns change over repeated exposure
  • Understanding task-driven behavior — how users search for specific information under realistic goals

Choose AI heatmaps when you need:

  • Design iteration — testing 5 layout variations before the meeting tomorrow
  • A/B test planning — identifying which elements to test before committing traffic
  • Landing page optimization — verifying that your CTA and value proposition are visually dominant
  • Quick audits — screening competitor pages or reviewing a redesign before handoff
  • Pre-launch validation — a final attention check before a campaign goes live

Use both together:

The most effective research workflow combines both. Use AI heatmaps to screen dozens of design candidates in minutes — checking that visual hierarchy, CTA placement, and scroll journey fundamentals are sound. Then invest in lab-grade eye tracking for the 2-3 final candidates where you need to understand scan paths, reading patterns, and task completion in depth.

The 80/20 of attention research

Here's the uncomfortable truth about attention research: 80% of design attention problems are obvious from a saliency map. You don't need a $15,000 eye-tracking study to discover that your CTA is invisible, your hero image competes with your headline, or your navigation draws more attention than your value proposition.

These are visual hierarchy failures — and they show up clearly in AI-generated heatmaps because they stem from the same low-level features (contrast, size, color, position) that saliency models are trained to detect. A 5-second heatmap scan catches what weeks of A/B testing would eventually reveal through poor conversion rates.

102030165 — dead zone090018002700360045005400px
ONE 5-SECOND SCAN, SECTION BY SECTION — THE DEAD ZONE AT 3,600 PX IS THE KIND OF FINDING WEEKS OF A/B TESTING WOULD SURFACE. UNISAL OUTPUT, DROPNIR.COM, DESKTOP.

The remaining 20% is where eye tracking earns its cost. Complex multi-step flows, information-dense dashboards, accessibility testing, reading comprehension analysis — these require understanding how attention unfolds over time, not just where it lands first. No saliency model can tell you whether a user understood the third paragraph of your terms of service.

80%

Problems AI heatmaps catch

Invisible CTAs, broken visual hierarchy, competing focal points, poorly placed key content, attention dead zones below the fold. These are structural issues visible in first-second saliency.

20%

Problems that need eye tracking

Reading comprehension, task-completion flows, accessibility barriers, scan path analysis over multi-step journeys, and behavioral differences between user segments. These require temporal gaze data.

The best tool is the one you actually use

Eye tracking is powerful. It's also expensive, slow, and logistically complex enough that most design teams never do it. The average product team ships dozens of pages, campaigns, and redesigns per year — and tests the visual attention of exactly zero of them.

AI heatmaps don't replace eye tracking any more than a spell checker replaces an editor. But they eliminate the most common excuse for not testing: friction. When checking attention takes 5 seconds instead of 4 weeks, you do it on every design, not just the ones important enough to justify a research budget.

If the friction of eye tracking means you never test, AI heatmaps are infinitely better than nothing. Start testing today — and save the lab for when you know exactly what question to ask.

Try it now

See what your users see — in seconds. Free, no signup required.

Generate heatmap