
Everything in the box
One attention model. Every way to use it.
Analyze, understand, fix, prove, deliver — every feature below ships today, on the same peer-reviewed saliency model.
Attention Score /100 — the ten-second verdict
The free scanner: paste a URL, get a score out of 100 and a blurred heatmap in seconds. No account needed.
- Score /100, hot-zone map and one actionable insight — before any signup
- Percentile against every page ever scanned, linked to the public Attention Index
- An embeddable badge for your README or footer — it updates at every re-scan
42/100
Better than 38% of pages scanned
Designs & mockups — score it before it exists
Drop a JPG or PNG — a Lovable export, a Figma frame, a client's V1 — and score it before a single line of code ships. Same model, same metrics as a live URL.
- The page doesn't need to be online — score the mockup before the debate, not after the launch
- Compare two versions of the same design by score — the A/B argument before any traffic
- Results land in your dashboard history like any other scan
mockup-v2.png
JPG · PNG · MAX 10 MB
LiveHeat — the attention lab, on your real site
Not a screenshot tool: LiveHeat runs the model on your page as you use it. Four modes, one canvas — each answers a different question.
Live RT — the page under your cursor
Capture your tab and watch the heatmap re-render in real time (~190 ms per frame) while you scroll, hover, resize or open a menu. What you see is exactly what gets analyzed — dropdowns, modals and hover states included.
“Does my menu steal attention from the CTA when it opens?”
Regions — draw a zone, get its share
Draw any zone on the page — a CTA, a banner, a face — and get the exact share of predicted attention it captures. Select several zones and compare them: the A/B argument in one number.
“What % of attention does my hero button actually get?”
Scrollcast — the attention video
LiveHeat records a full scroll of your page and renders it as a saliency video: attention flowing, section after section. Export it, drop it in a client deck — it's the before/after nobody argues with.
“Where exactly does the eye give up on the way down?”
Scrub — your scroll drives the timeline
Flip Scrub on and the page scroll becomes the video timeline: you walk the attention story frame by frame, at exactly the position your visitor would be. The most natural way to review a long page.
“What does the visitor see at 2 400 px — and what do they miss?”
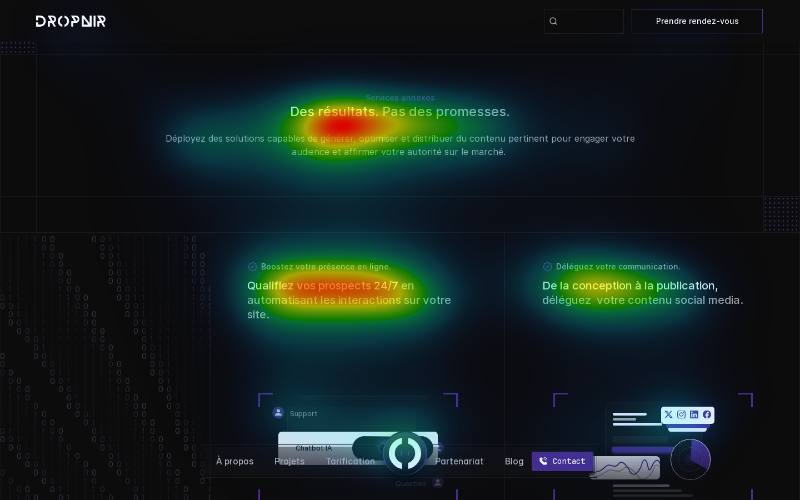
Words Map — word-level reading attention on your actual copy. No other tool does this.
Every text block is scored twice: what it says, and whether the eye actually reads it. Not per paragraph — per word, with a 0→1 reading-attention score on each token and a verdict on each sentence.
WHAT THE MODEL WEIGHS
- Reading position — the first 3 words of a sentence weigh ×3, a paragraph opener ×2 (F-pattern)
- Form — numbers, percentages and concrete dates pull hard; short words open lines better
- Semantics — power words lift, abstract jargon and filler sink
- The output rewrites what gets skipped: the report proposes sharper lines for cold sentences
YOUR COPY, AS THE EYE SEES IT
Our platform empowers teams to seamlessly optimize workflows — cut reporting time from 3 hours to 20 minutes, starting at $29.
THE SCALE — EVERY WORD, 0 → 1
Multi-device audit — one URL, three verdicts
Desktop, tablet and mobile captured section by section — each screen scored on attention, focus, coverage and hierarchy.
- The same page rarely scores the same twice — mobile often wins on focus, desktop on coverage
- Whole-site mode (Pro): point it at a domain, every page discovered via sitemap gets its own report
- Every hotspot gets a why: contrast, faces, isolation, hierarchy — written by a vision AI looking at your actual pixels.
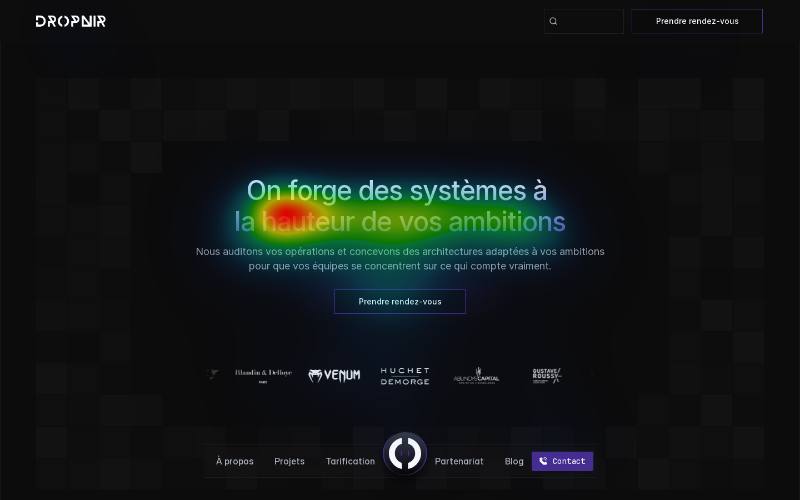
desktop · 1440 — 35
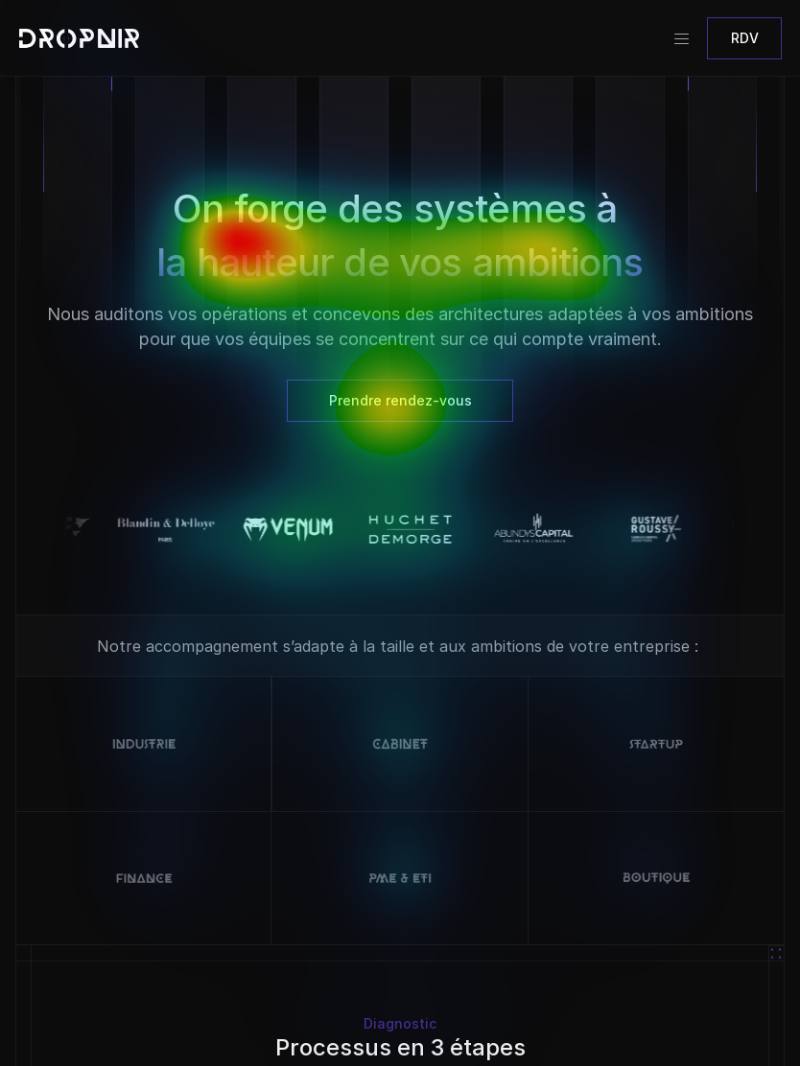
tablet · 834 — 45
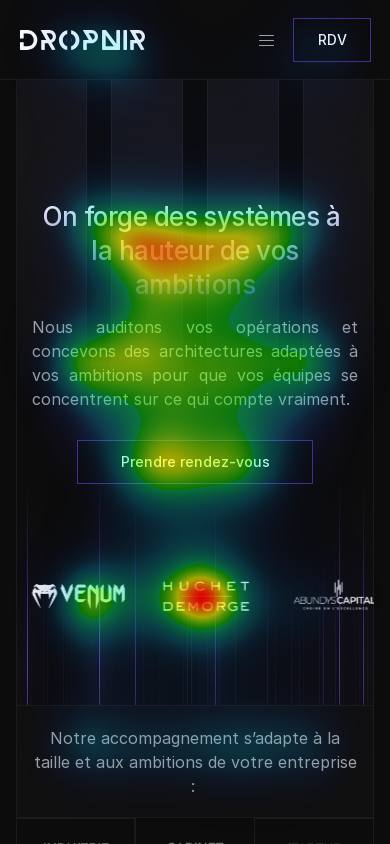
mobile · 390 — 58
Report Studio — from colors to decisions
Executive summary, per-section notes, cross-device findings and priority actions — AI-written from your real metrics. Generated server-side: close the tab, the finished report waits in your dashboard.
- Title, metas, Hn structure, alt, structured data, canonical — scored and prioritized in the same report.
- Ask anything about your report — the analyst knows every section, score and recommendation, and answers with what's NOT already on the page.
- Scan up to two competitors alongside your page: where they capture attention better, where you're ahead.
- Reports in English or French — the AI analyst answers in your language
- Every report has a public read-only link — plus 12 months of history on Pro, unlimited on Agency
42
ATTENTION
35
SEO
3
DEVICES
Redesign the desktop hero — add a product visual, double the headline size.
Restructure the mid-scroll sections that flatline (1800–2700px).
Pull the final CTA up 1000px, or make it sticky on mobile.
THE AI ANALYST KNOWS EVERY SECTION, SCORE & FIX OF YOUR REPORT
Fix — corrections anchored in your real HTML
The AI proposes targeted copy, style and structure fixes anchored in your page's real HTML — previewed live on your site with red markers on every change.
- Each fix is previewed on a live copy of your page — red markers show exactly what changed
- Accept, reject or edit each suggestion — nothing is applied blindly
ATTENTION /100 · AFTER FIX
Pulse — prediction vs reality
A cookieless snippet measures how real visitors actually behave — scroll reach, dwell, rage clicks — and confronts the prediction with reality. No banner needed.
- No cookies, no consent banner — aggregated signals only, GDPR-friendly by design
- The report gains a reality column: predicted attention vs measured behavior, zone by zone
PREDICTED VS REAL — SCROLL REACH
Nobody else closes this loop: the model predicts, Pulse verifies, and every gap makes the next prediction sharper.
Badges — score it, then prove it
Every scan ships a live badge for your README or footer, and pages scoring 80+ earn the Certified label — rare on purpose, verifiable by anyone.
- The badge links to the public, re-runnable scan — anyone can verify the number
- Certified at 80+, Gold at 90+ — under the threshold, the badge simply doesn't exist
- Every report has a public read-only link. Send it to a client or teammate — no login required on their side.
Score 80+ to earn the Heatpoints Certified badge.
Deliverables — where the work leaves the tool
Export the full report as a clean PDF. On Agency, it carries your logo and your brand — ready to invoice as your own deliverable.
- Clean PDF export on every plan (small watermark on Free)
- On Agency: your logo, your name, your accent color — nothing from us
A UX audit bills at €2,000–8,000. One white-label report sold pays back your year.
In your stack — browser, design file, pipeline
Chrome extensionCOMING SOON
Heatmap whatever you're browsing — dashboards, checkouts, staging behind a VPN. It sees what you see, live as you scroll.
Apply for beta→
Figma pluginCOMING SOON
Score any frame before a line of code exists. The heatmap drops onto your canvas as a layer for your next design review.
Apply for beta→
Public API
One key, every capability: heatmaps, reports, SEO audits, text analysis. The eval layer for AI-generated UIs.
API for developers→
The fastest way to judge a feature list: run it.
Free, instant, no account needed.