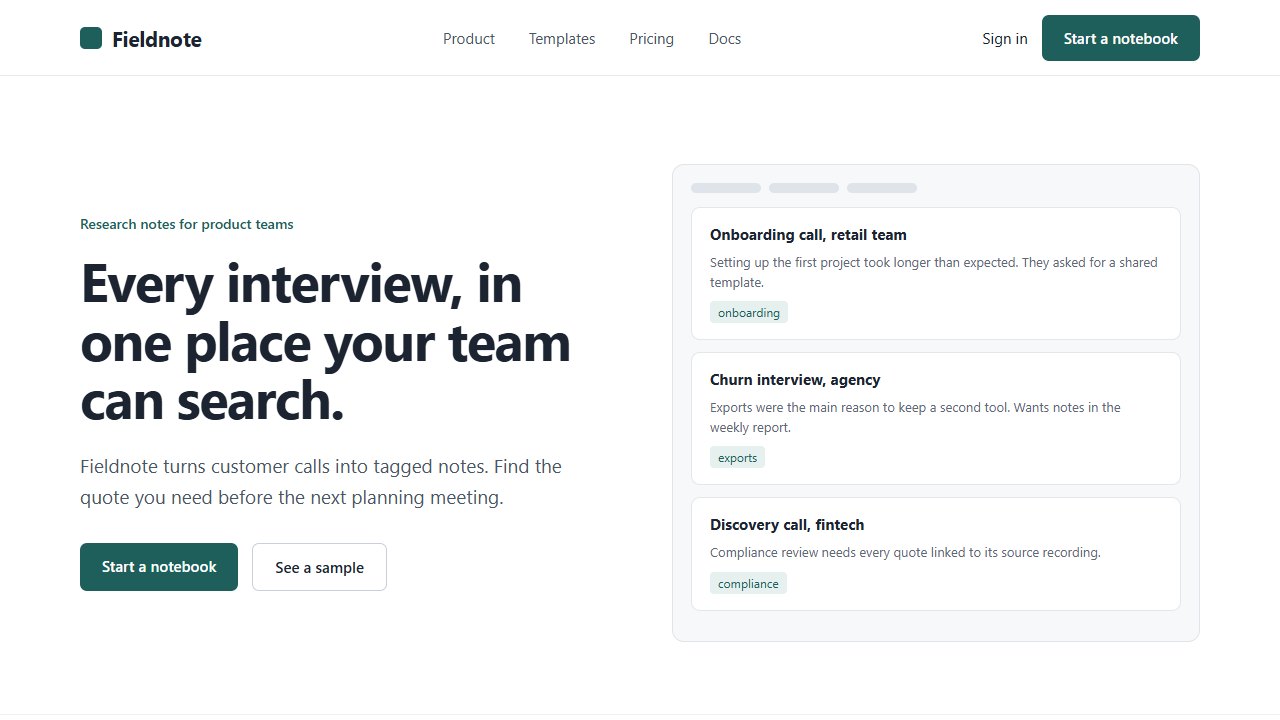
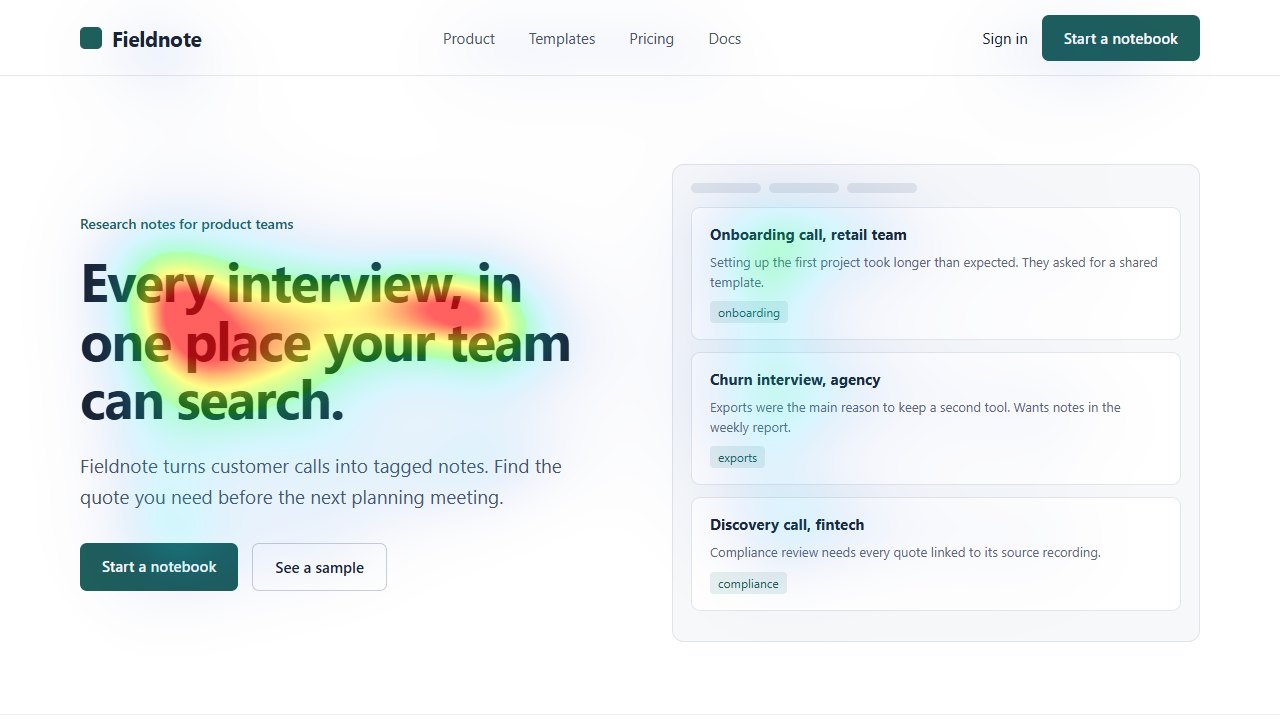
A map of likely visual attention
A saliency map assigns a value to every location in an image. Higher values mark regions that a model expects to stand out and attract gaze during free viewing. Rendered in colour over the original, it becomes the familiar attention heatmap.
The word describes a prediction about the image, not a record of what a person did. No visitor clicked, scrolled or looked at your file to produce it. That distinction decides which questions the map can answer.
Where the idea comes from
Early computational models combined simple features such as colour, intensity and orientation contrast into a single saliency map. Itti, Koch and Niebur's 1998 model is a widely cited example of that approach: regions that differ strongly from their surroundings receive higher values.
Later models learn the mapping from large collections of eye-tracking and attention data. UNISAL, the model Heatpoints uses, is a lightweight encoder-RNN-decoder network trained to predict saliency for both images and video. Its authors report results on image benchmarks such as SALICON and MIT300.
References: Itti, Koch & Niebur (1998), IEEE TPAMI · UNISAL paper and implementation
How saliency models are evaluated
Researchers compare predicted maps with fixations recorded from participants who viewed the same images. Public benchmarks such as the MIT/Tübingen Saliency Benchmark hold back those fixations and score submitted models with several metrics, because no single number captures every aspect of agreement.
A good benchmark score means the model tends to agree with free-viewing fixations on that kind of image. It does not guarantee the same agreement on your interface, your audience or a task such as comparing prices.
References: MIT/Tübingen Saliency Benchmark
What a saliency map can support
Use it to review visual hierarchy before a design reaches people. It can suggest that a decorative illustration competes with the headline, or that a thumbnail's subject disappears into a busy background. Those are concrete observations you can check by looking at the original again.
It is also repeatable. The same image and settings produce the same map, so you can compare a controlled revision with its original and see where the emphasis moved.
- State which element should carry the message.
- Generate the map and name the elements under the strongest regions.
- Change one thing, such as size, contrast or crop.
- Compare the two maps and keep the observation, not a verdict.
What it cannot tell you
A saliency map does not know what your words mean, whether the offer is trustworthy or what the viewer is trying to do. It has no information about order of viewing, reading or time spent. Warm colours are relative within one image, so they are not a percentage of people.
When the decision depends on behaviour, such as clicks, sign-ups or watch time, collect behavioural evidence. The map helps you decide which variant is worth putting in front of people; the audience decides which one works.
References: How Heatpoints calculates its metrics