Current availability
There is no Heatpoints Figma plugin to install today. Earlier versions of this article described an integrated workflow that is not publicly available. The current method is to export a frame from Figma and upload that image to the web tool.
An exported frame keeps the review independent of your live site. You can inspect a draft, an ad or a mobile screen before development. The prediction concerns the exported pixels; it does not understand your Figma layer names, component structure or prototype interactions.
References: Current Figma integration status
Prepare a useful export
Choose a frame that represents something a person will actually see. A canvas containing several unrelated screens or annotations gives the model a different composition from the final interface.
- Select the frame, including its intended background and final text.
- Export a PNG, JPEG or WebP supported by the image tool, within the size limit shown there.
- For a long page, export a realistic viewport first. Review later sections separately if your question concerns scrolling.
- Upload the export, wait for the map and inspect the original alongside the overlay.
Run a controlled design revision
Write down one question before changing the frame: does the price compete with the product image, or is the primary action visually lost? Duplicate the frame and change one variable that could affect that relationship.
Export both versions with the same dimensions and compare them in Championship. A higher score is not sufficient evidence that the revision is better. If a decorative shape becomes the dominant region, the score can move while the business message becomes harder to notice.
References: Compare exported frames
Export settings that keep the map comparable
The image tool accepts PNG, JPG and WebP up to 10 MB. Beyond the format, four export choices decide whether two frames can be compared at all.
| Setting | Recommendation | Why |
|---|---|---|
| Width | The width people will see: 1280 px for desktop, 390 px for a phone | The same layout at two widths gives two different maps |
| Scale | 1x | A 2x export doubles the pixel count without changing the composition; keep exports of two versions at the same scale |
| Content | Final copy, real images, the frame's own background | Placeholder text and grey boxes change where the emphasis falls |
| Framing | One screen, no annotations, no neighbouring frames | The model reads everything in the image, including your notes |
| Format | PNG or JPG, under 10 MB | What the tool accepts today |
References: The image tool
A worked example: one exported design, two versions
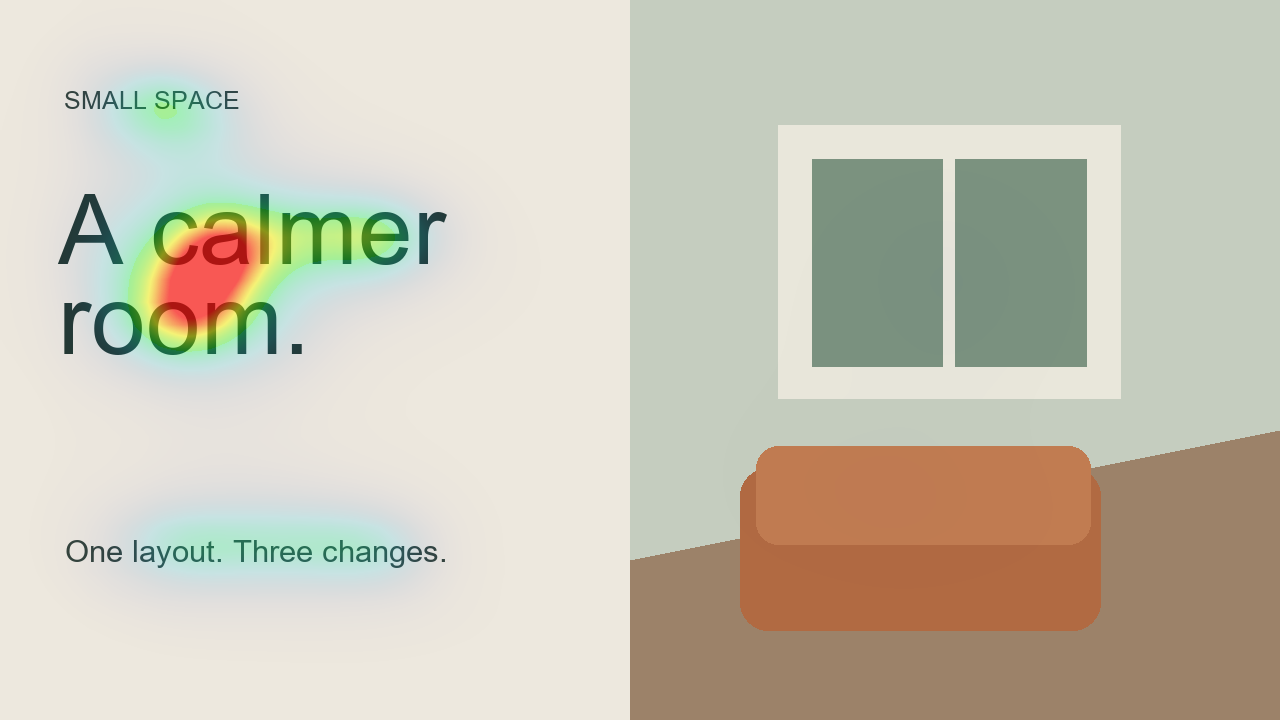
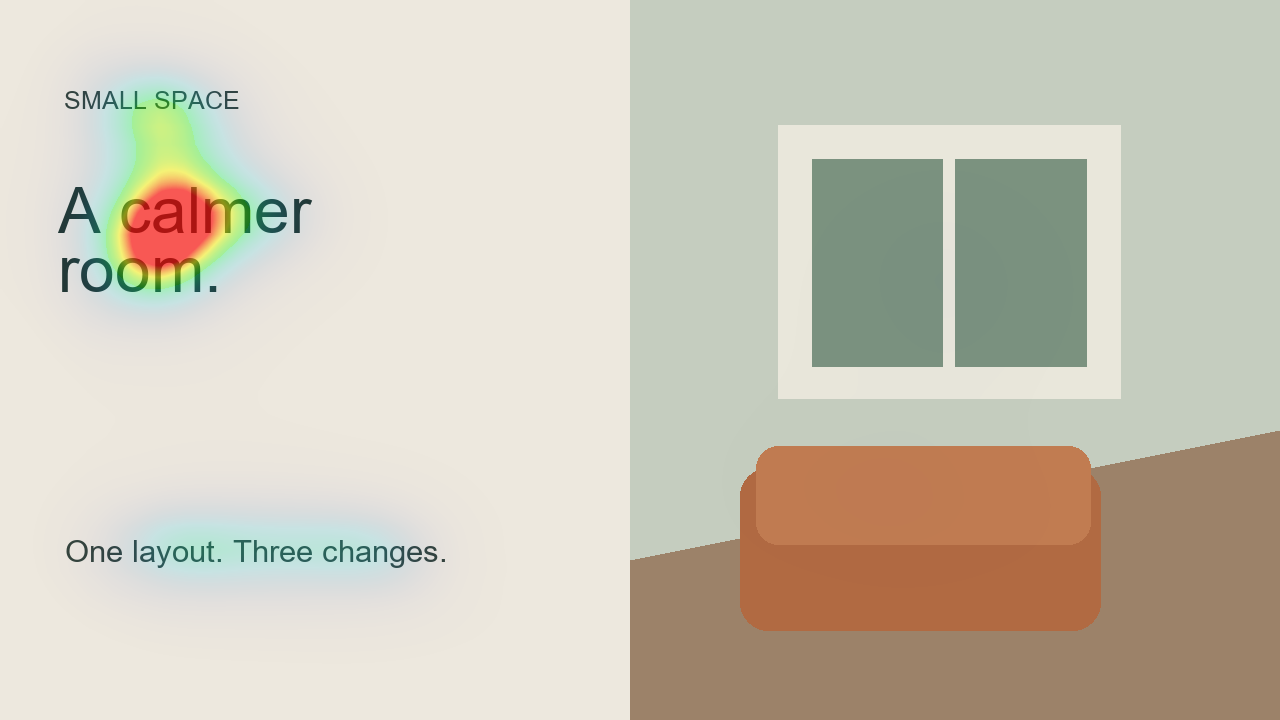
The fictional room-design thumbnail on this site is a drawn design, not a photograph, which makes it a fair stand-in for an exported frame. Version B changes one thing: a smaller headline. The table shows what the model reported. The score rose from 32 to 42 because the remaining headline dominated more clearly, and the strongest cell moved from centre-left to top-left. The room, the subject of the design, stayed cool in both versions.
That is a typical outcome of a controlled revision: the metrics moved, and the map answered a narrower question than the one the designer had in mind. The next revision should touch the room, not the headline.
| Metric | Version A | Version B, smaller headline |
|---|---|---|
| Composite score | 32 | 42 |
| Attention | 5 | 3 |
| Focus | 56 | 49 |
| Hierarchy | 23 | 66 |
| Coverage | 6% | 4% |
| Strongest cell | Centre left | Top left |
References: Provenance of the ad and thumbnail experiments
What this workflow cannot test
A static export cannot tell you whether a menu opens correctly, a form is understandable or keyboard focus follows the right order. It also cannot reproduce the motion of an interactive prototype or the behaviour of a real visitor.
Use the heatmap to identify a visual question, then test the prototype with people. Once the page is implemented, the Chrome extension can review the actual browser rendering. Differences in fonts, wrapping and viewport size may change the prediction.
References: Review the implemented page in Chrome