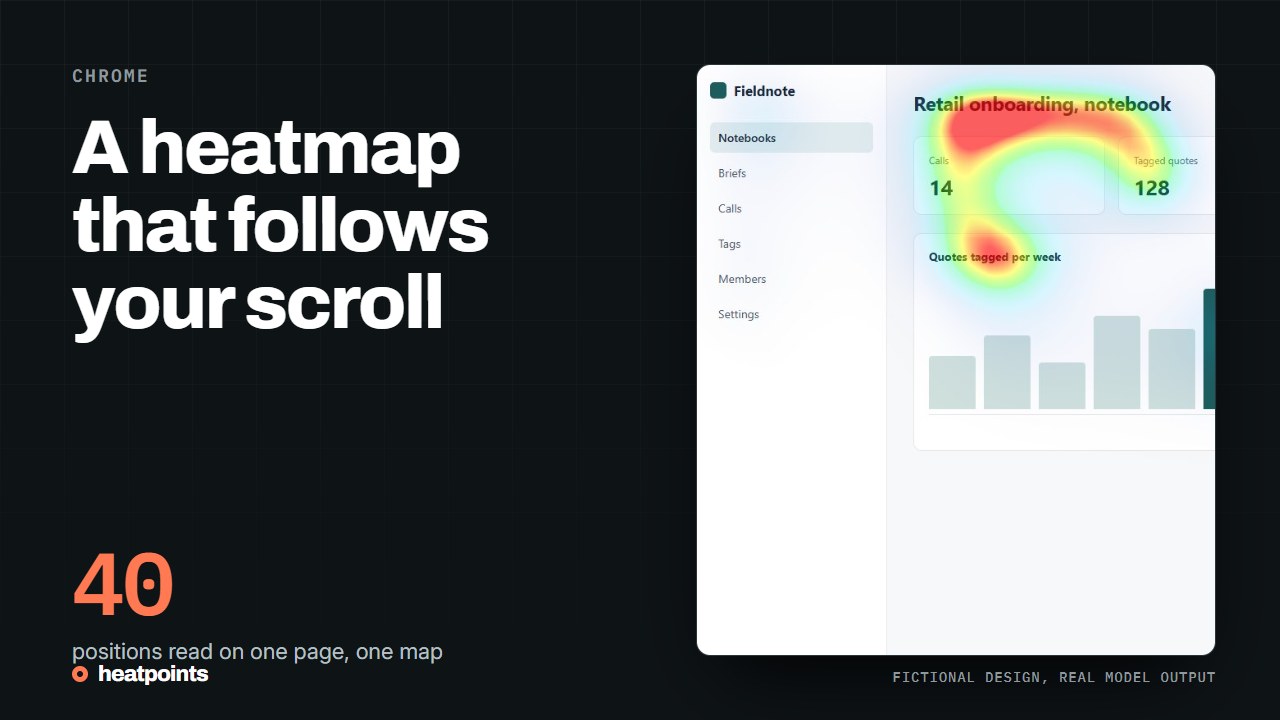
What live means here
Heatpoints captures the visible area of the tab you choose and asks the server to calculate an attention map. The result is overlaid on that page. When you scroll or resize the window, the extension requests a fresh prediction after a short pause. It does not observe visitors or record your eyes.
This is useful for reviewing a page in its actual browser state, including a signed-in dashboard. It is not a recording of an entire browsing session. Moving the pointer over an element alone does not guarantee a new capture, and animation can change the page while a prediction is being calculated.
Install, activate and examine one screen
Start on a normal website tab. Chrome protects some internal pages, including its settings and extension store, from this kind of capture.
- Install Heatpoints from its Chrome Web Store listing and pin it if you want quick access.
- Open the page to review, click the extension and read the capture notice before starting.
- Wait for the overlay. Compare the strongest areas with the headline, product and main action you intended to emphasise.
- Scroll to the next section and pause. Wait for the updated overlay before interpreting that screen.
- Turn the overlay off to recheck the original design, then stop the extension when you finish.
References: Heatpoints on the Chrome Web Store
Keep captures comparable
Choose a browser width, zoom level and page state before reviewing variants. A closed accordion and an open accordion are different images. A desktop hero and a mobile hero are different compositions. A shift in the overlay can therefore be caused by the capture, not by a meaningful improvement.
For a repeatable comparison, export two screenshots at matching dimensions and open Championship. Record the change you made, such as reducing the illustration or moving the primary action. Check the region you intended to affect rather than only the overall score.
References: Compare your screenshots
Email verification, uploads and private pages
Initial scans are available before email verification. The extension then asks you to verify an email address. Usage limits and server capacity apply; live does not mean unlimited frames or a guaranteed frame rate.
Captures are sent to Heatpoints servers. A page behind a login can contain names, financial information or private messages, so check what is visible before activating capture. The browser feature does not make the upload local-only.
References: Data handling
A worked scroll on a fictional page
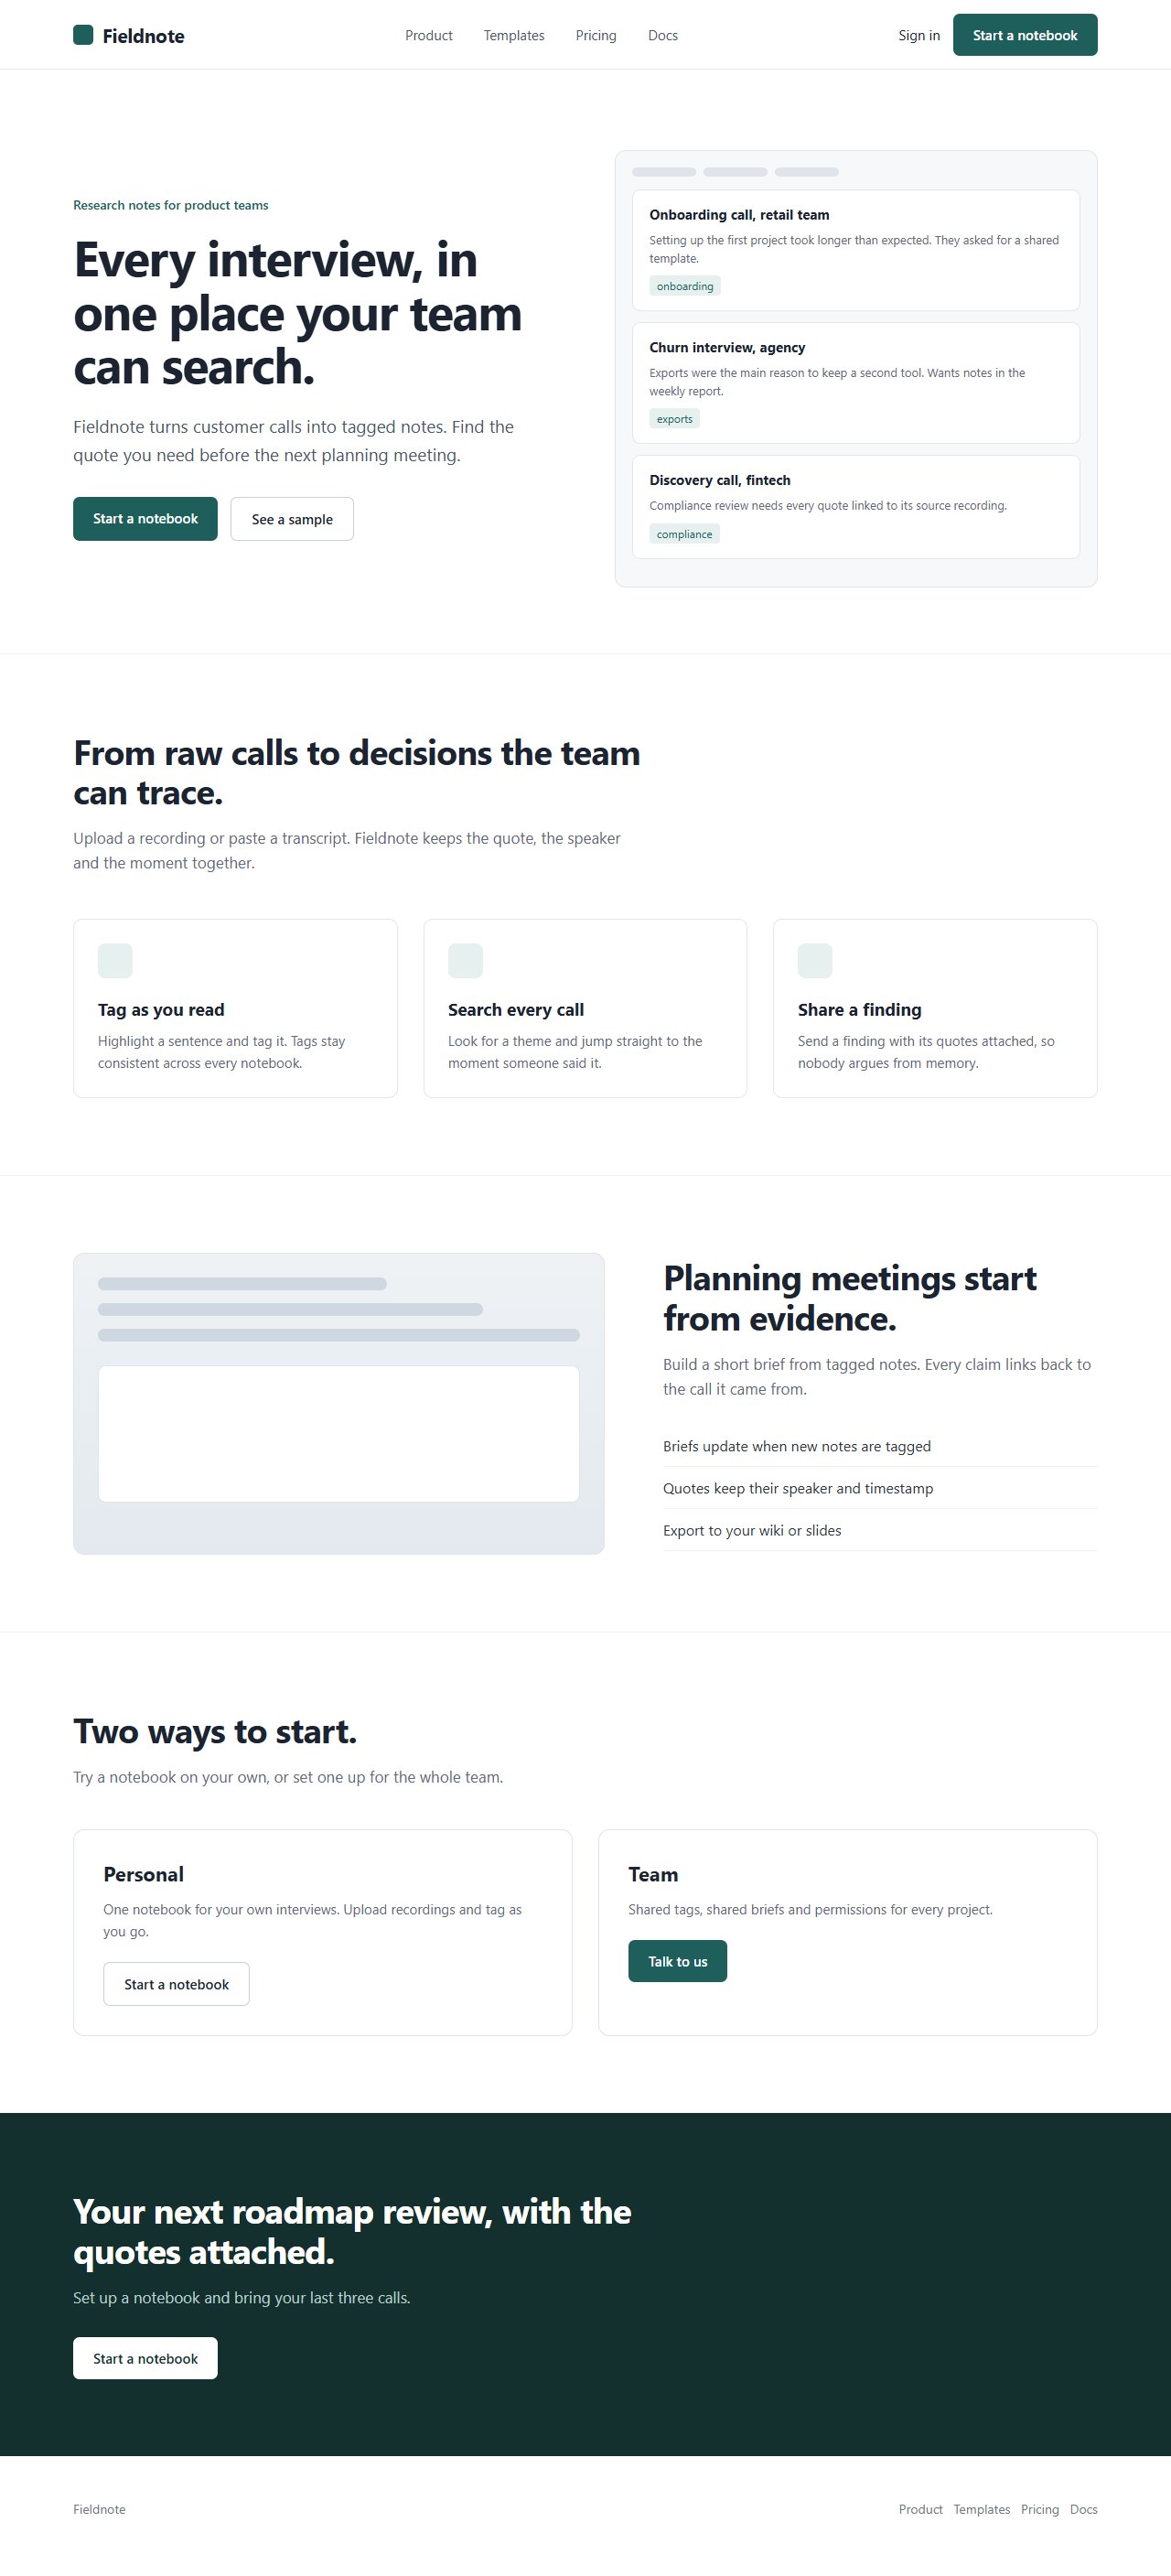
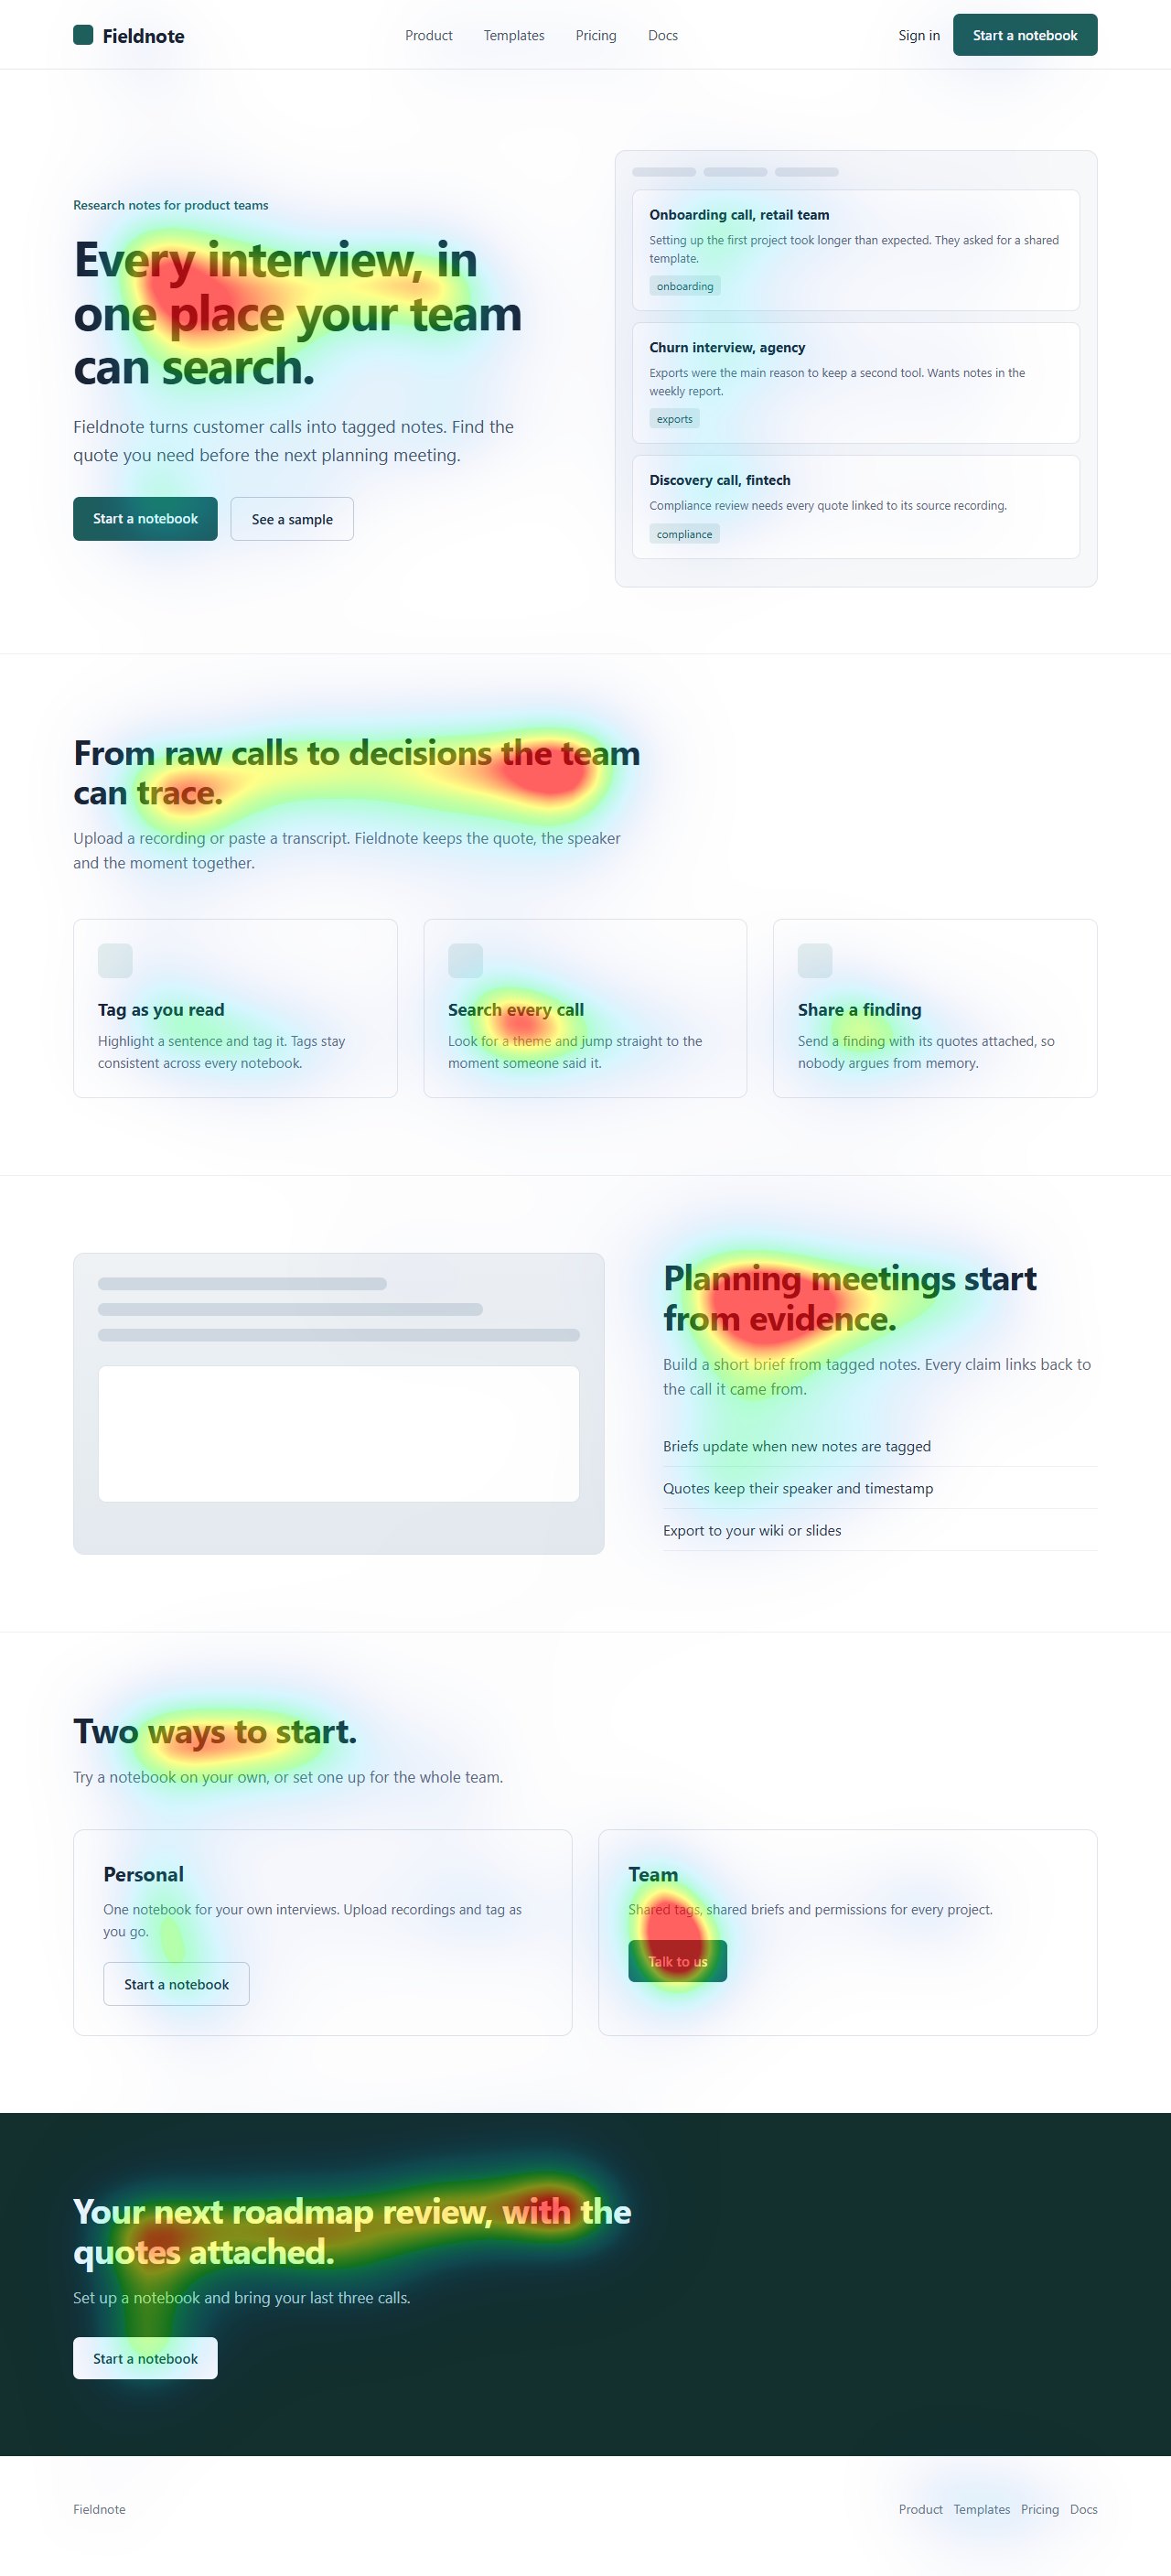
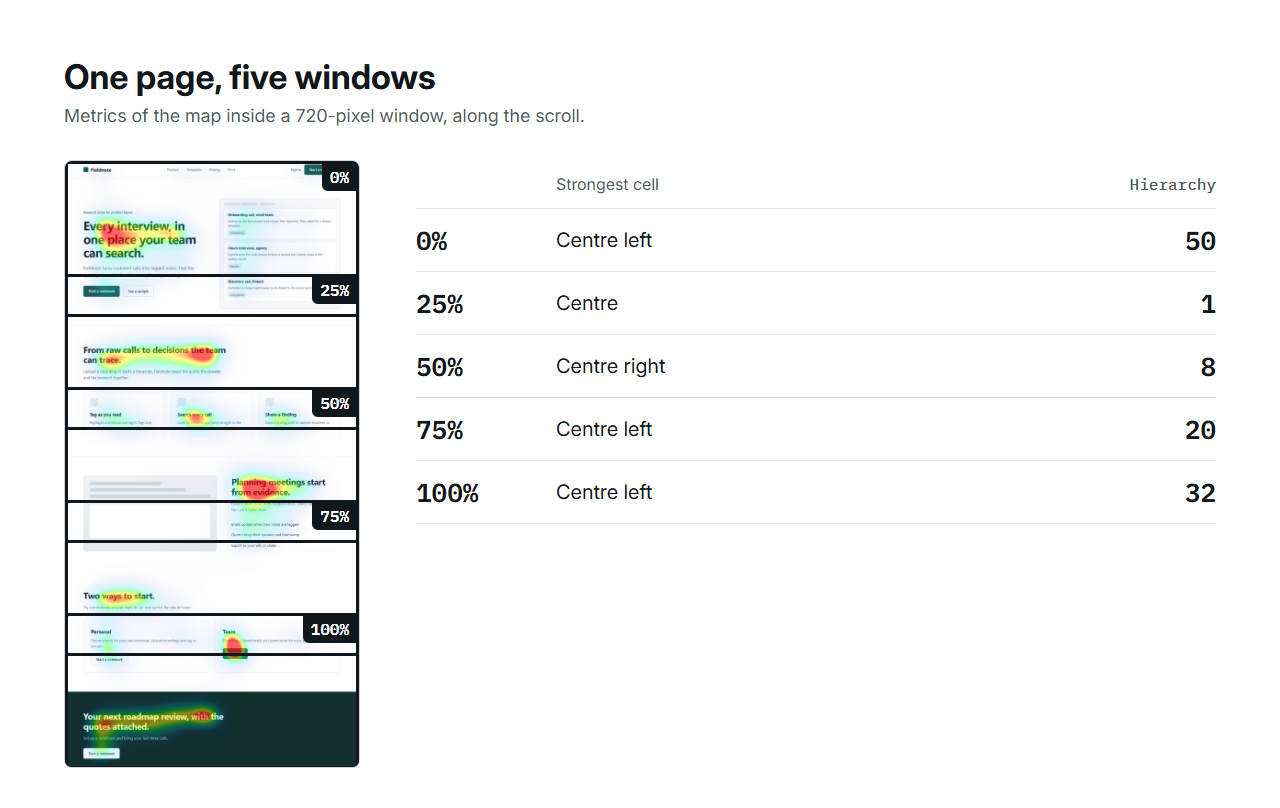
To show what the extension reports as you move down a page, the fictional Fieldnote landing page used across this site was predicted as a whole, then the metrics were read inside a 720-pixel window at forty positions. The table gives four of them. The strongest cell changes at every stop, and the hierarchy metric, the contrast between the leading cell and the next, drops to 1 in the middle of the page where three equal cards share the screen.
That is the kind of observation the overlay gives you as you scroll: not a path, but a sequence of screens where something leads, or nothing does.
| Scroll position | Attention | Focus | Hierarchy | Coverage | Strongest cell |
|---|---|---|---|---|---|
| 13% down | 13 | 87 | 25 | 14% | Top left |
| 38% down | 13 | 88 | 1 | 15% | Top centre |
| 62% down | 8 | 72 | 2 | 9% | Top right |
| 87% down | 11 | 80 | 19 | 12% | Bottom left |
References: Provenance, hashes and metrics · Readout of all forty scroll positions
Checks before you trust an overlay
A live overlay is only as good as the capture behind it. Five things to check before you act on a warm region.
- The page has finished loading, including web fonts and lazy images.
- You paused long enough for the prediction to refresh after the last scroll or resize.
- The browser width matches the one your visitors use; the same page at 390 px gives a different map.
- No cookie banner, chat widget or overlay of your own is sitting on top of the content.
- You wrote down what should lead on this screen before reading the colours.
If the overlay looks wrong
Check that the page has finished loading, pause scrolling and make sure the overlay corresponds to the current viewport. If the extension reports a quota or authentication error, complete the indicated step instead of repeatedly restarting capture. Very fast motion is a poor basis for a static attention prediction.
A warm region is a review prompt. It cannot establish what someone read, which button they clicked, or whether they understood the offer. Follow up with an actual task-based user test when those are the questions you need answered.